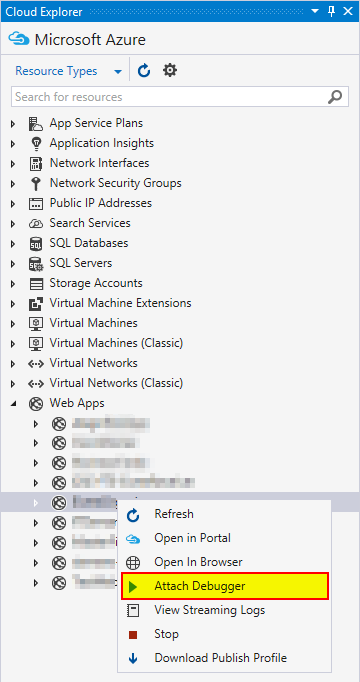
Recently my colleagues and I created a lot of SharePoint provider-hosted addins - in our case that is just a MVC Website hosted on Azure that talks balk to SharePoint. And I have to say it is good fun because we could actually debug a production site/business application in case something unforeseeable happens (aka. bugs). And the integration in Visual Studio via the Cloud Explorer could not be simpler. Right click on the website, attach debugger and see the problem.
That worked a long time perfectly for us - but something changed and Visual Studio 2015 dropped the connection once a breakpoint is hit (sometimes even earlier). Strangely debugging still worked with Visual Studio 2013.
Symptoms
Attaching with a Visual Studio 2015 Debugger either from Cloud Explorer, Server Explorer or directly via “attach to process” attaches the debugger briefly (if at all) and then results in two errors:
-
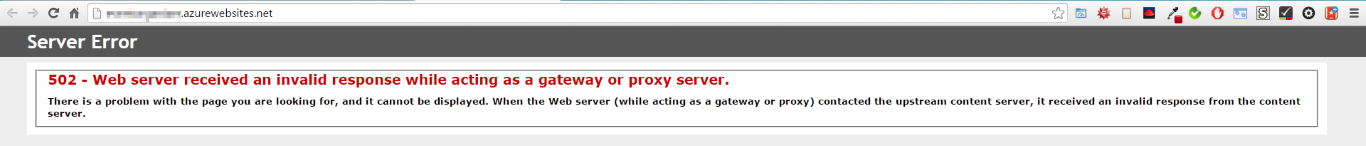
The web browser shows: 502 - Web server received an invalid response while acting as a gateway or proxy
-
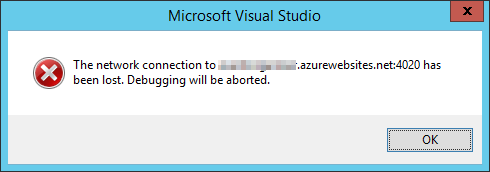
In Visual Studio 2015 an error box shows: The network connection to <hostname>.azurewebsite.net:4020 has been lost. Debugging will be aborted.
Fix
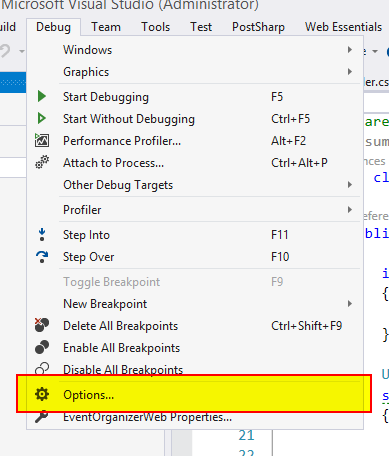
The fix is rather simple. In Visual Studio open Debug menu from the top and click on Options:
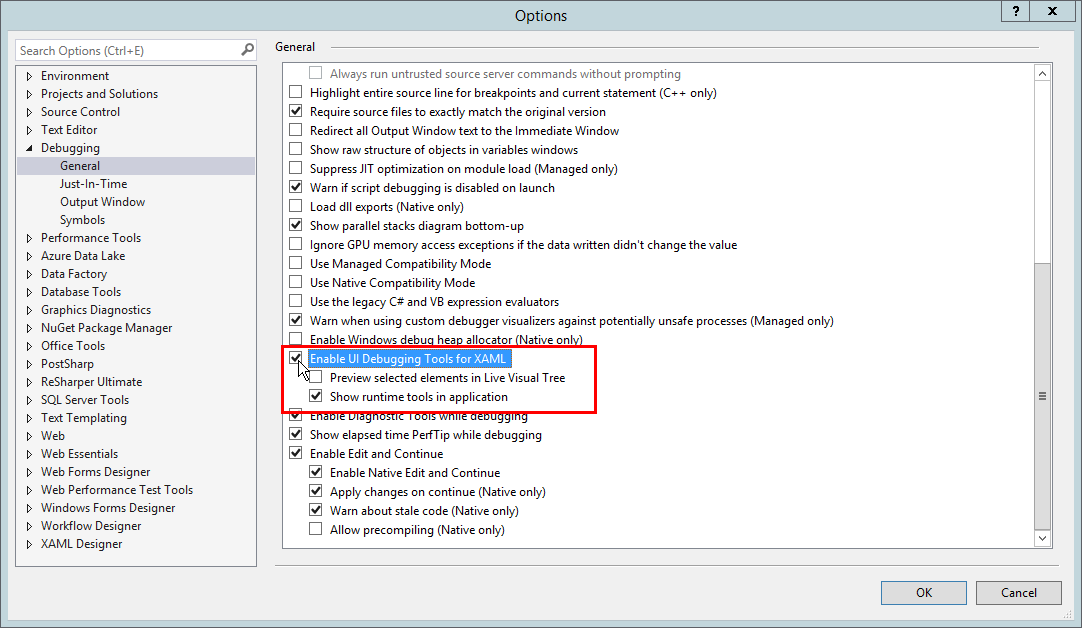
Then click on Debugging > General and find the option “Enable UI Debugging Tools for XAML” and uncheck it.
After that, debugging worked like a charm again.
Thank you!
I did not find that one out myself - the awesome Microsoft Support (I am looking at you Akash Khandelwal!) spent hours troubleshooting my problem. He early noticed that there is a something with WPF in the logs but we initially ruled that one out. After a while his team suggested to disable this option - and it worked!
During the debugging session I learned a lot about Azure Website troubleshooting - great stuff!

Share this post
Twitter
Facebook
LinkedIn
Email